 TERM 13
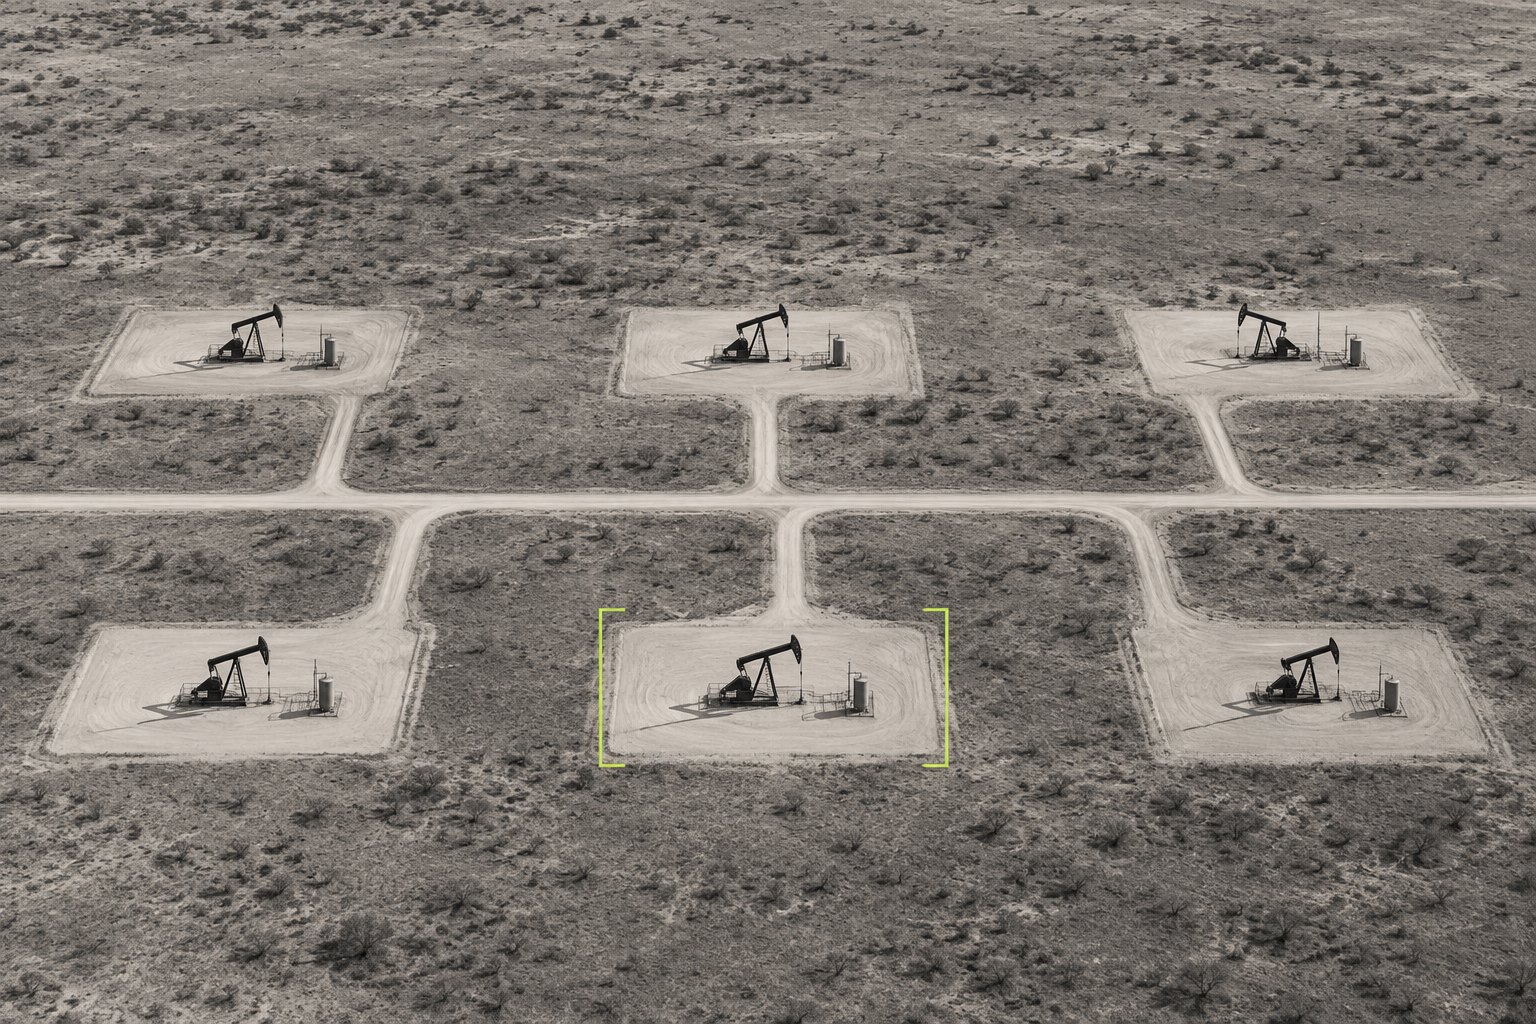
An oil and gas team can open Upstream+ and see how a well or group of properties performed over time. They can compare revenue and operating expenses across months, see where a cost moved, and narrow down where to look next. The whole application grew out of the report that puts those numbers side by side. The Lease Operating Statement, or LOS.
One report, a lot of ways to build it.
An LOS answers a straightforward question. How did this property perform? Getting to the answer can take work. The underlying data may come from different accounting systems, and operators can group similar activity under different accounts. Put those reports next to each other and a difference in the numbers might reflect a real change, or just a difference in how someone classified it.
For a team reviewing several properties or months, that ambiguity comes up over and over. Before anyone can ask why operating costs moved, someone has to get the numbers into a form they can compare.
We built the application around the LOS.
We built Upstream+ as a standalone reporting application. It imports accounting data and maps it into the report structure the team uses to review the business. The team can save a report configuration and use it again as new data arrives. That gives a recurring review a consistent starting point.
The LOS also gave the rest of the app something to build on. A saved report can feed a dashboard view, so a summary and the report behind it draw from the same configuration. Someone can start with the trend and go back to the report when a number deserves a closer look.

The next question gets more specific.
With comparable months in view, a reviewer can ask whether an increase came from one property or showed up across several. They can check which expense category moved and bring that detail to the person who can explain it. The report gets them far enough to ask a better question about what happened in the field.
Upstream+ started with a job people already had to do. Once the app could do that job reliably, the same data and report structure could support a broader review of how the assets were operating.